在上篇文章使用 opentelemetry 与 jaeger 实现 flask 应用的链路追踪 | 那时难决 (duyixian.cn) 中,我们介绍了如何使用 opentelemetry 与 jaeger 对 flask 应用进行链路跟踪。
在真实的业务场景下多个服务间互相调用是十分常见的,在进行一些问题排查的时候有必要跟踪一个请求链路在各个服务中细节。
使用 opentelemetry 与 jaeger 同样可以实现跨应用的链路追踪。
原理 进行链路跟踪的核心概念是 trace,trace 是一个具有开始时间和结束时间的操作,它可以包含若干个 span,形成一个树状结构。
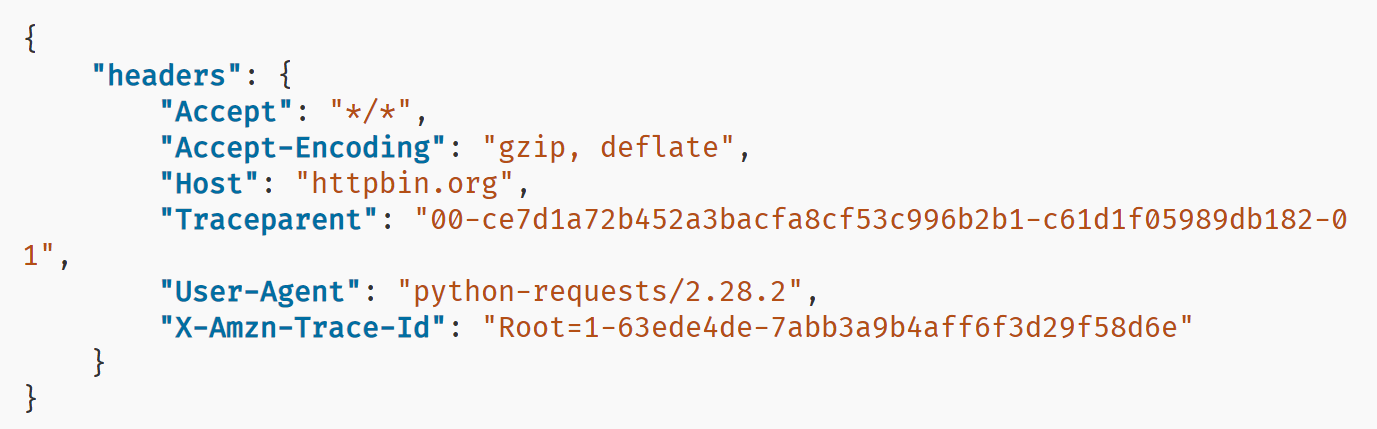
回到上一篇文章的场景,编辑main.py,定义/headers路由,使用 requests 库请求 https://httpbin.org/headers ,返回 requests 发起请求时的 header 信息。
1 2 3 @app.get("/headers" def headers (): return requests.get("https://httpbin.org/headers" ).json()
可以看到 headers 中有一个Traceparent,携带了 TraceId 信息。调用其他服务时,我们也需要将这个Traceparent传递给下游服务。
实现跨服务链路追踪 首先我们实现一个上游服务,用于演示跨应用链路追踪。这次我们使用 asyncio + FastAPI 来实现。asyncio 生态下的 httpx 和 fastapi 都有 opentelemetry 的支持。
先安装依赖:
1
2
pip install fastapi opentelemetry-instrumentation-fastapi pip install httpx opentelemetry-instrumentation-httpx
编辑upstream.py:
1
2
3
4
5
6
7
8
9
10
11
12
13
14
15
16
17
18
19
20
21
22
23
24
25
26
27
28
29
30
31
32
33
34
35
36
37
38
39
40
import fastapiimport httpxfrom opentelemetry import tracefrom opentelemetry.exporter.jaeger.thrift import JaegerExporterfrom opentelemetry.instrumentation.fastapi import FastAPIInstrumentorfrom opentelemetry.instrumentation.httpx import HTTPXClientInstrumentorfrom opentelemetry.sdk.resources import SERVICE_NAME, Resourcefrom opentelemetry.sdk.trace import TracerProviderfrom opentelemetry.sdk.trace.export import BatchSpanProcessordef configure_trace (app: fastapi.FastAPI ): trace.set_tracer_provider( TracerProvider(resource=Resource.create({SERVICE_NAME: app.title})) ) trace.get_tracer_provider().add_span_processor( BatchSpanProcessor( JaegerExporter( agent_host_name="localhost" , agent_port=6831 , ) ) ) FastAPIInstrumentor.instrument_app(app) HTTPXClientInstrumentor().instrument() app = fastapi.FastAPI(title=__name__) configure_trace(app) def get_client (): return httpx.AsyncClient() @app.get("/api/check-baidu" async def check_baidu (client: httpx.AsyncClient = fastapi.Depends(get_client ) ): resp = await client.head("https://www.baidu.com" ) return {"connected" : resp.status_code == 200 }
在upstream.py中,我们定义了一个 FastAPI 应用,它有一个/api/check-baidu路由,用于检查是否能够访问百度。
接下来使用 uvicorn 启动upstream服务:
1 uvicorn upstream:app --port 5001 --reload
编辑main.py,在/check路由中,使用 requests 库请求http://localhost:5001/api/check-baidu,返回请求结果。
1 2 3 @app.get("/check-baidu" def check_baidu (): return requests.get("http://localhost:5001/api/check-baidu" ).json()
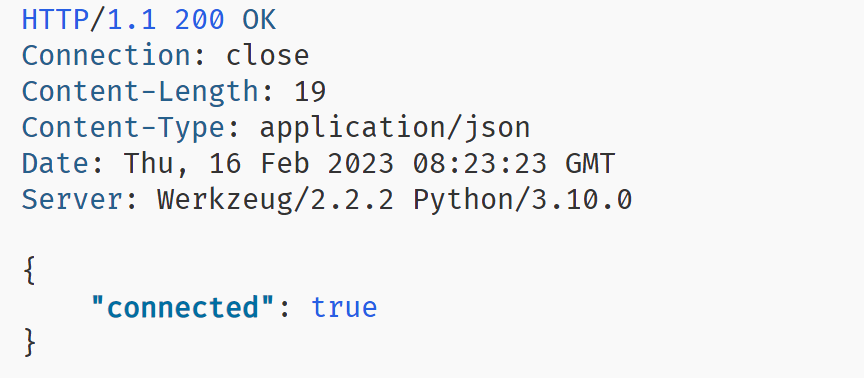
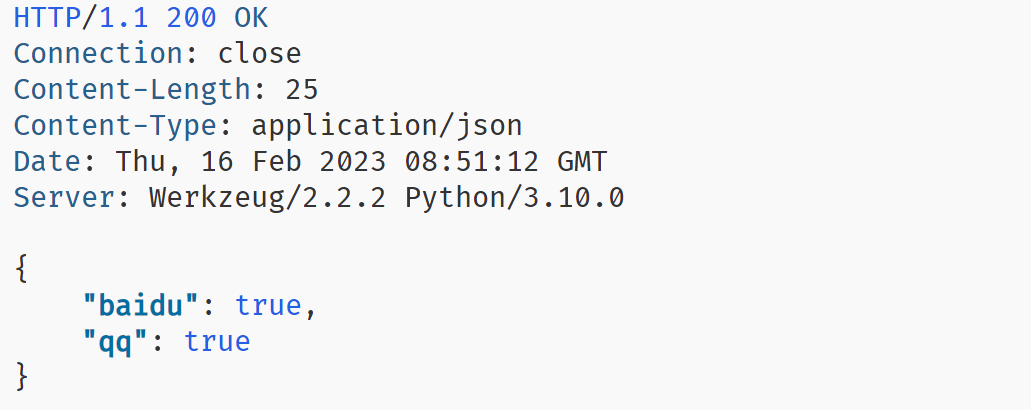
访问 http://localhost:5000/check-baidu ,可以看到请求成功:
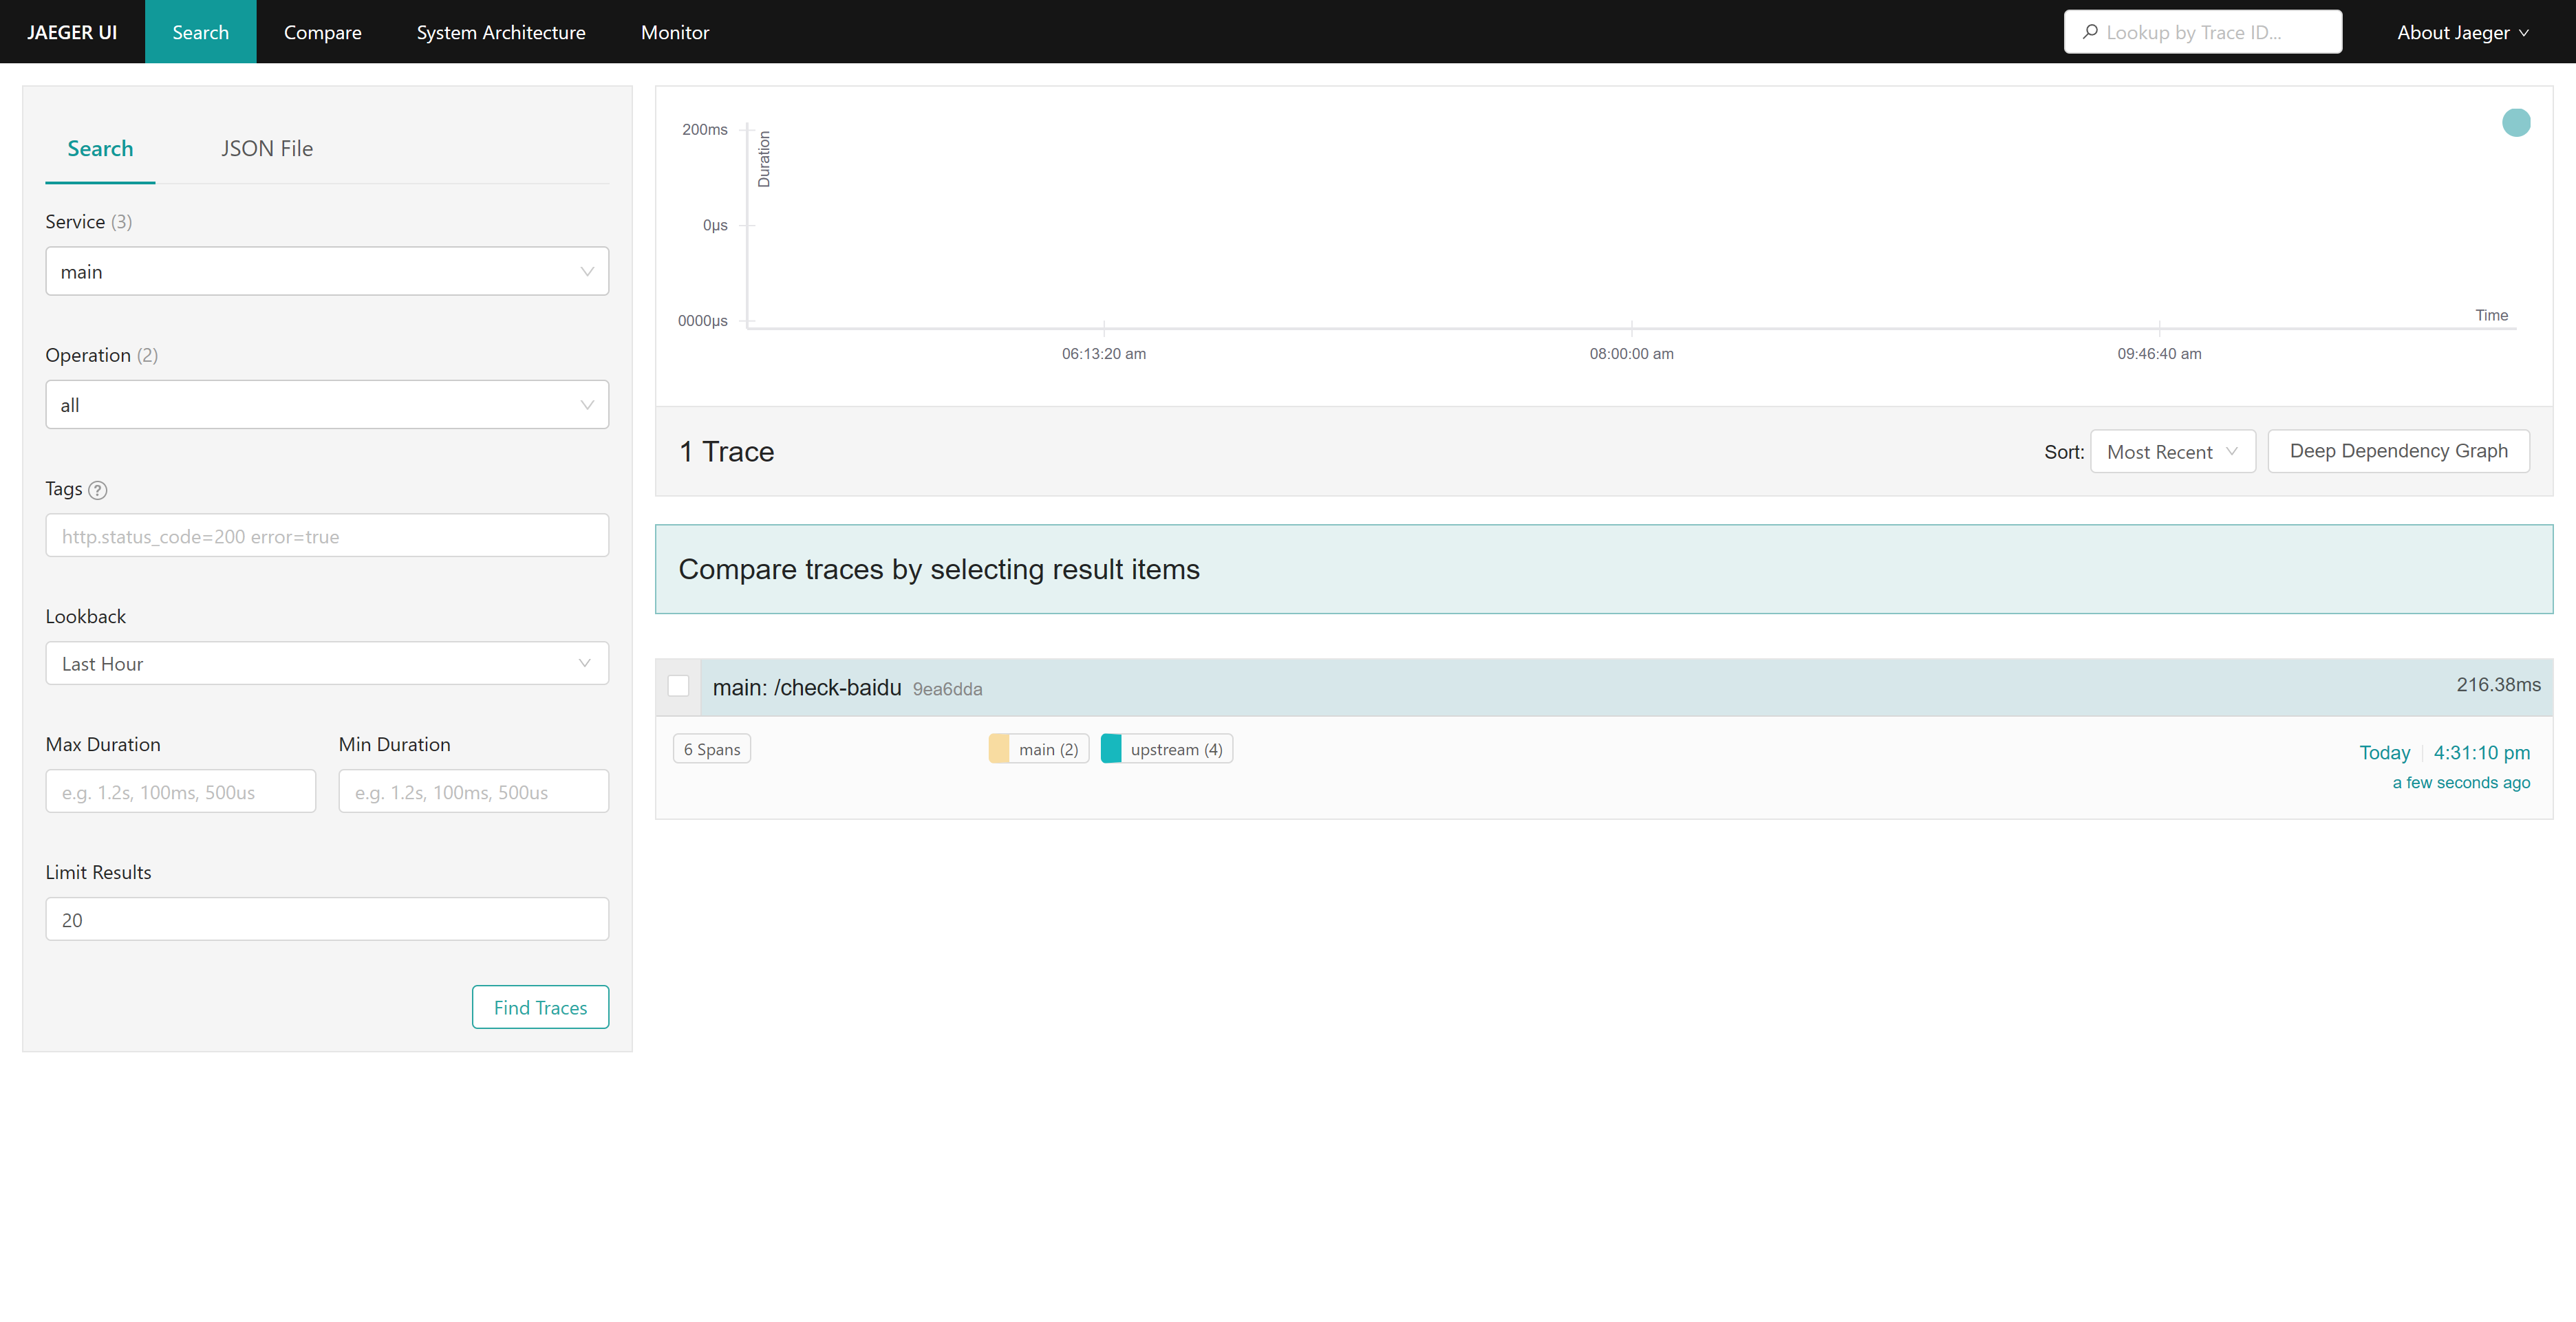
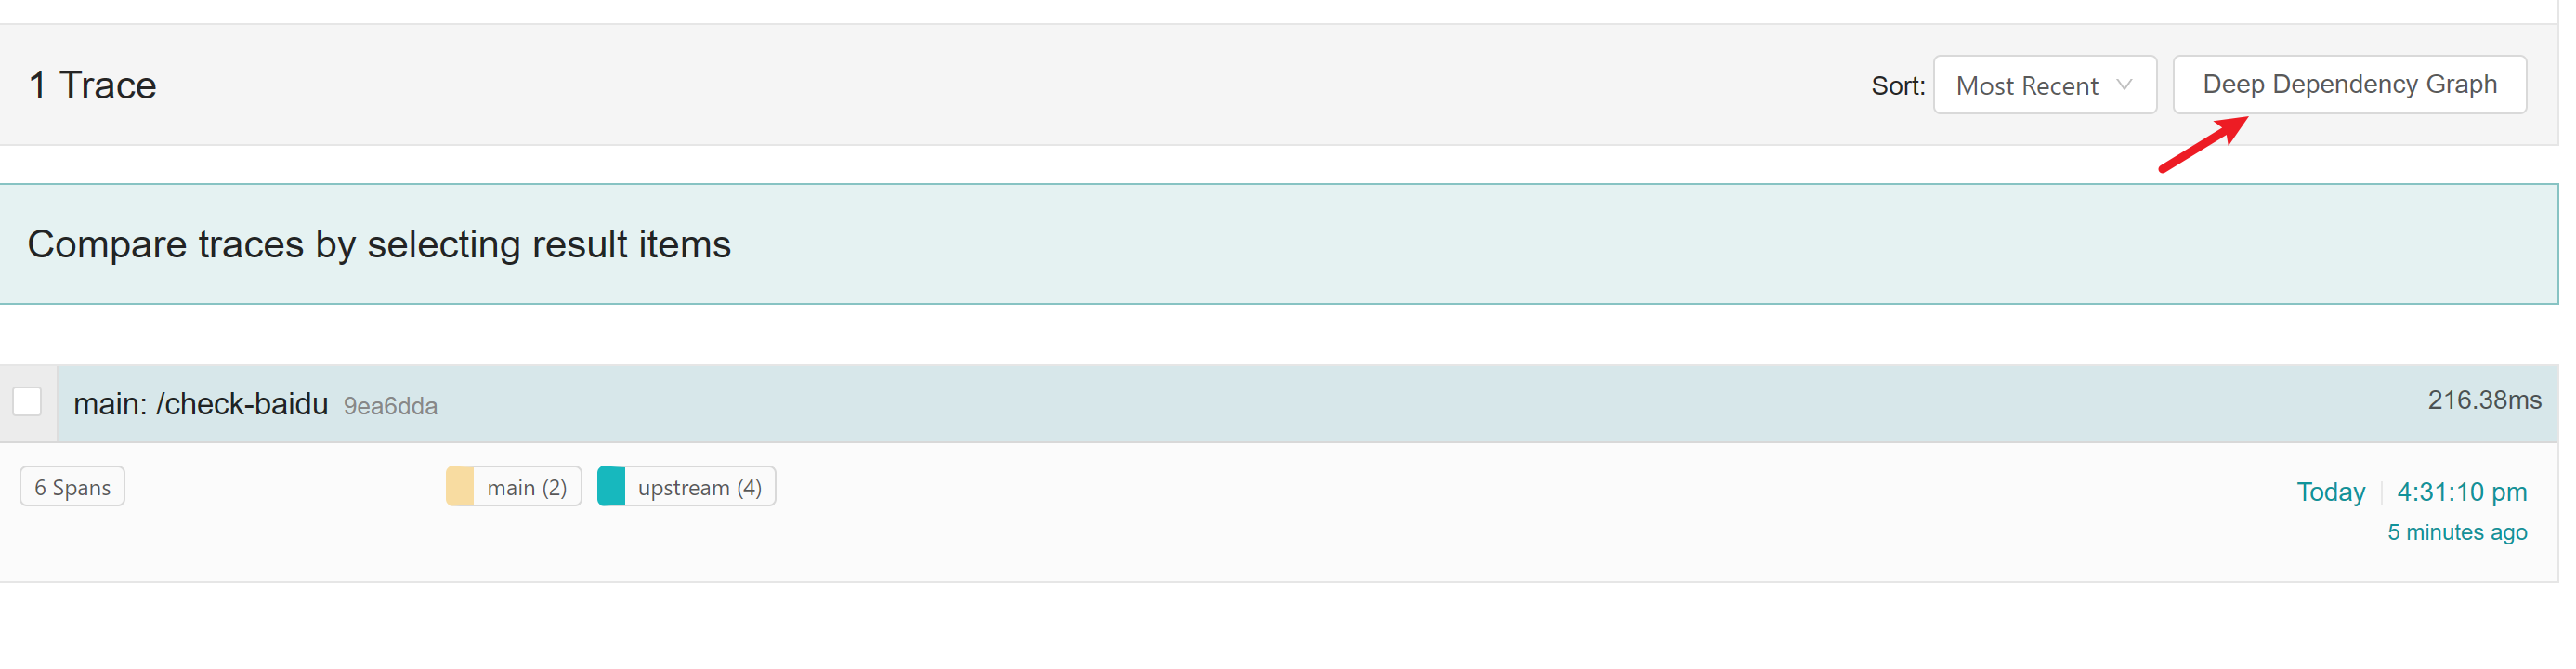
访问 Jaeger UI ,查看链路追踪信息:
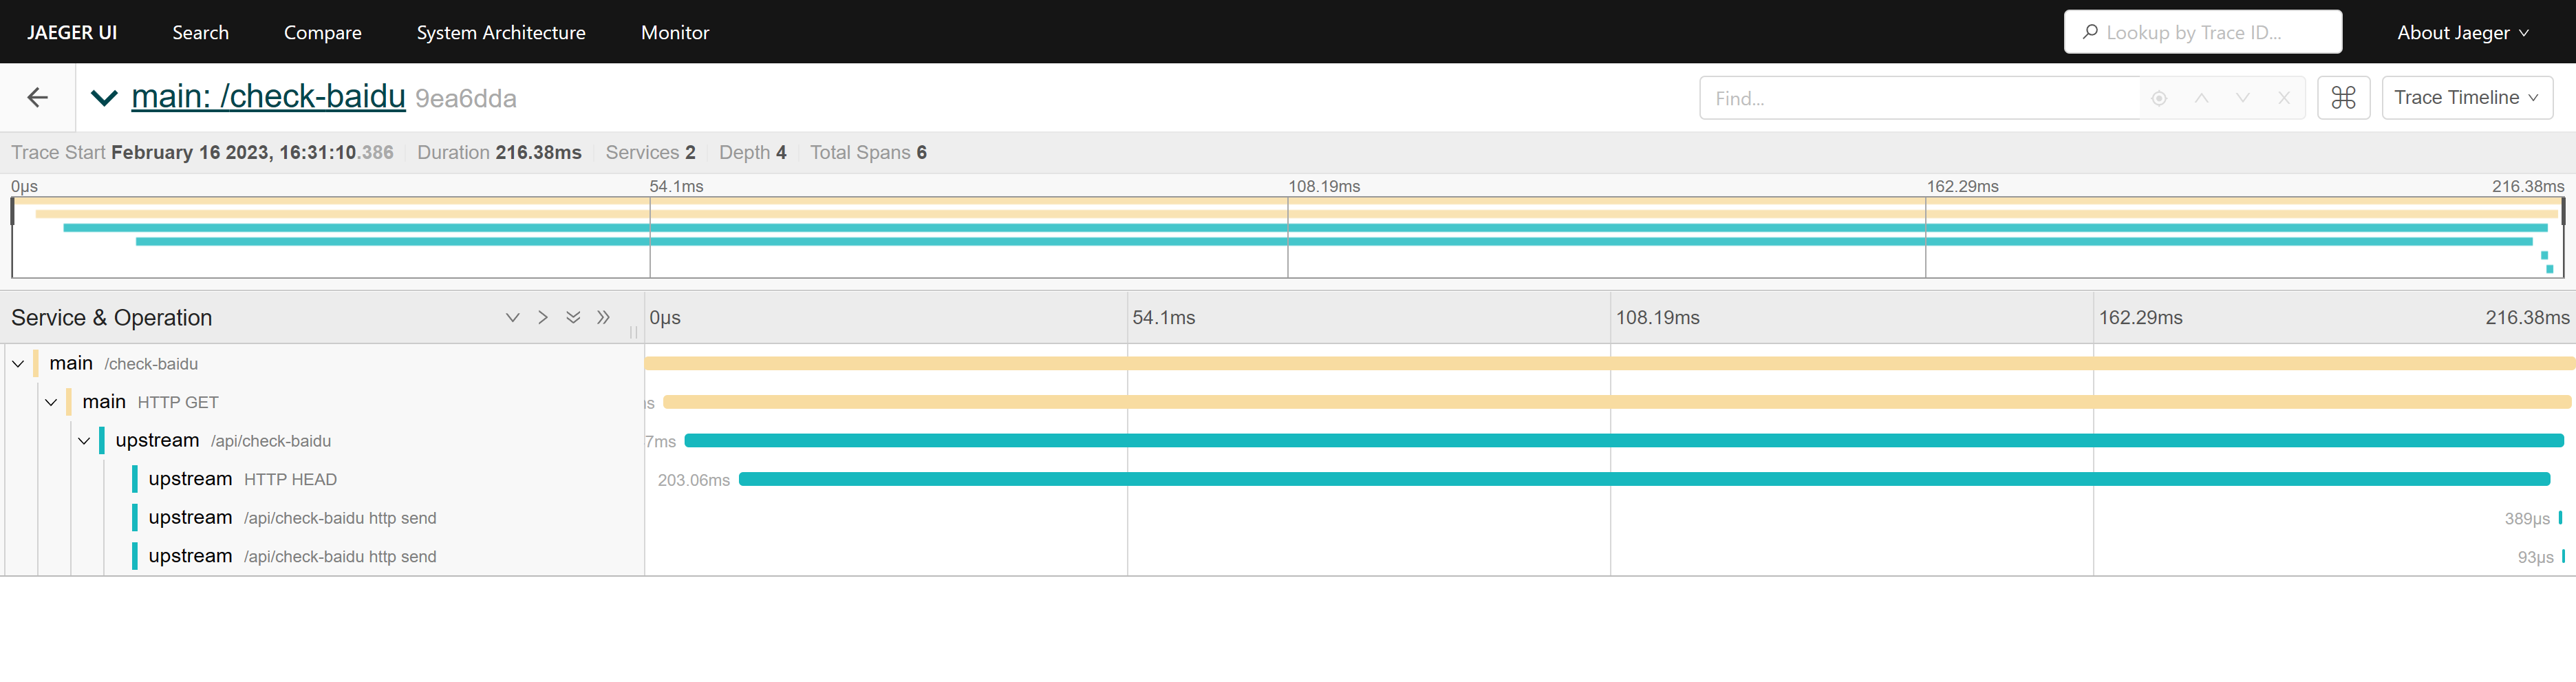
查看 trace 详情:
可以看到,我们的请求链路中包含了两个 span,分别是/check-baidu和/api/check-baidu,分别来自于两个服务。
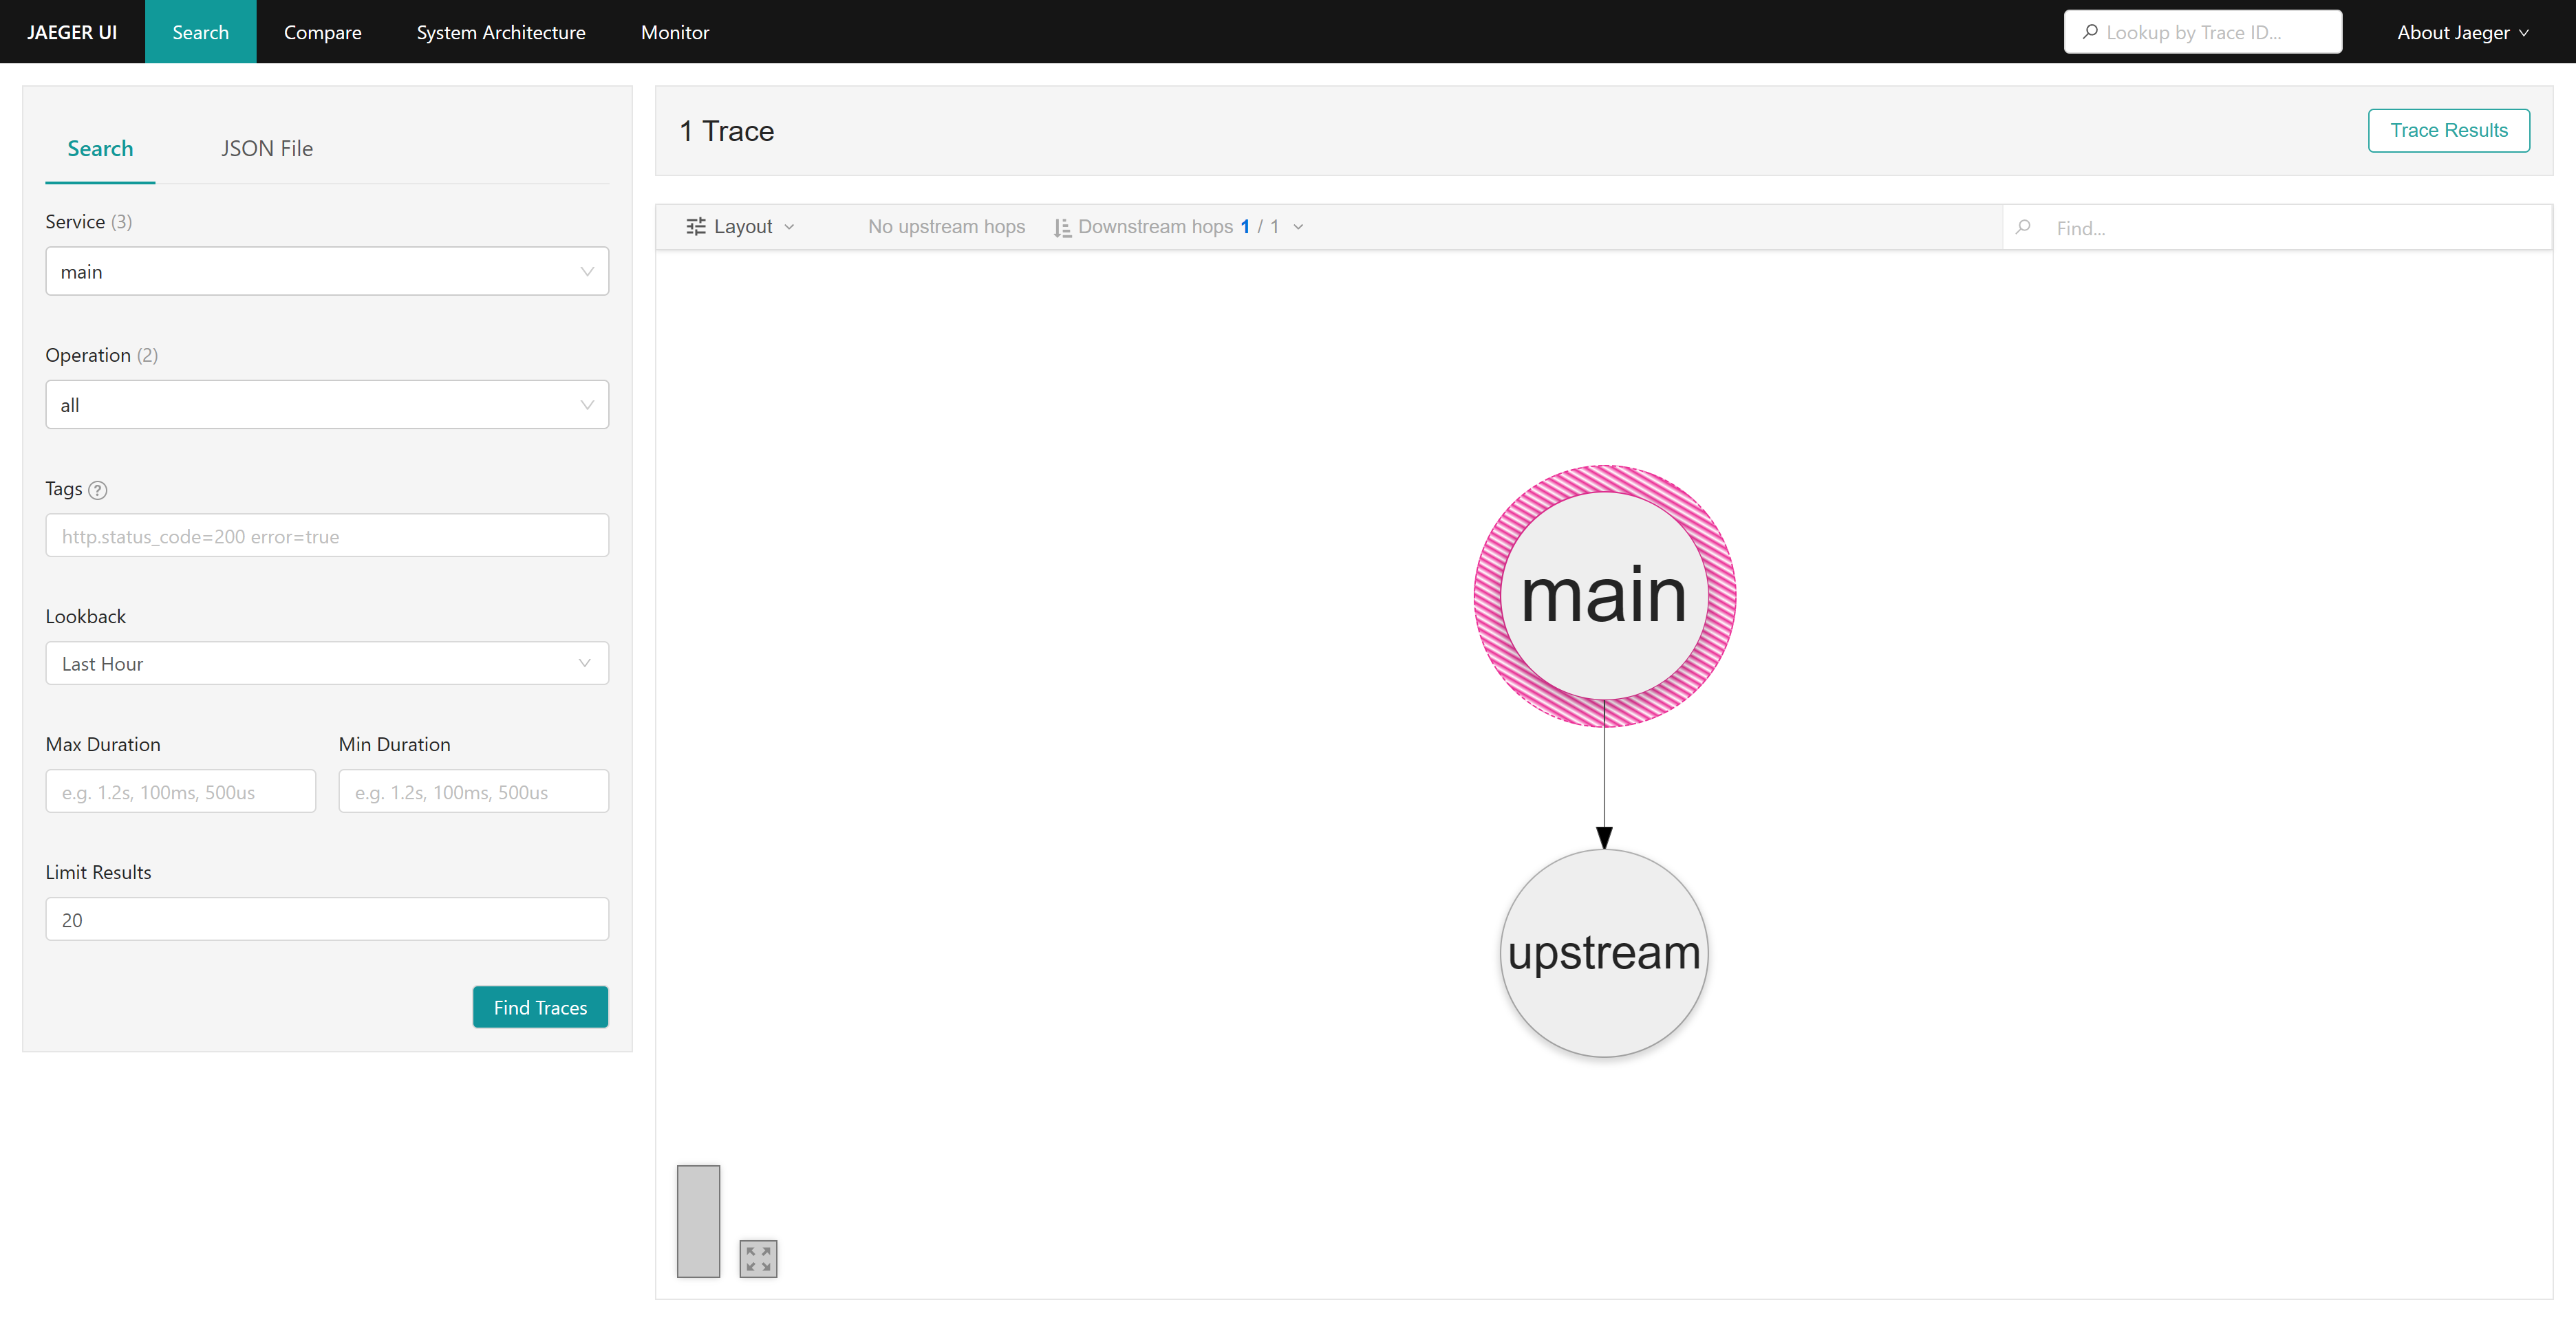
从Jaeger UI 也可以直接查看服务间的调用关系:
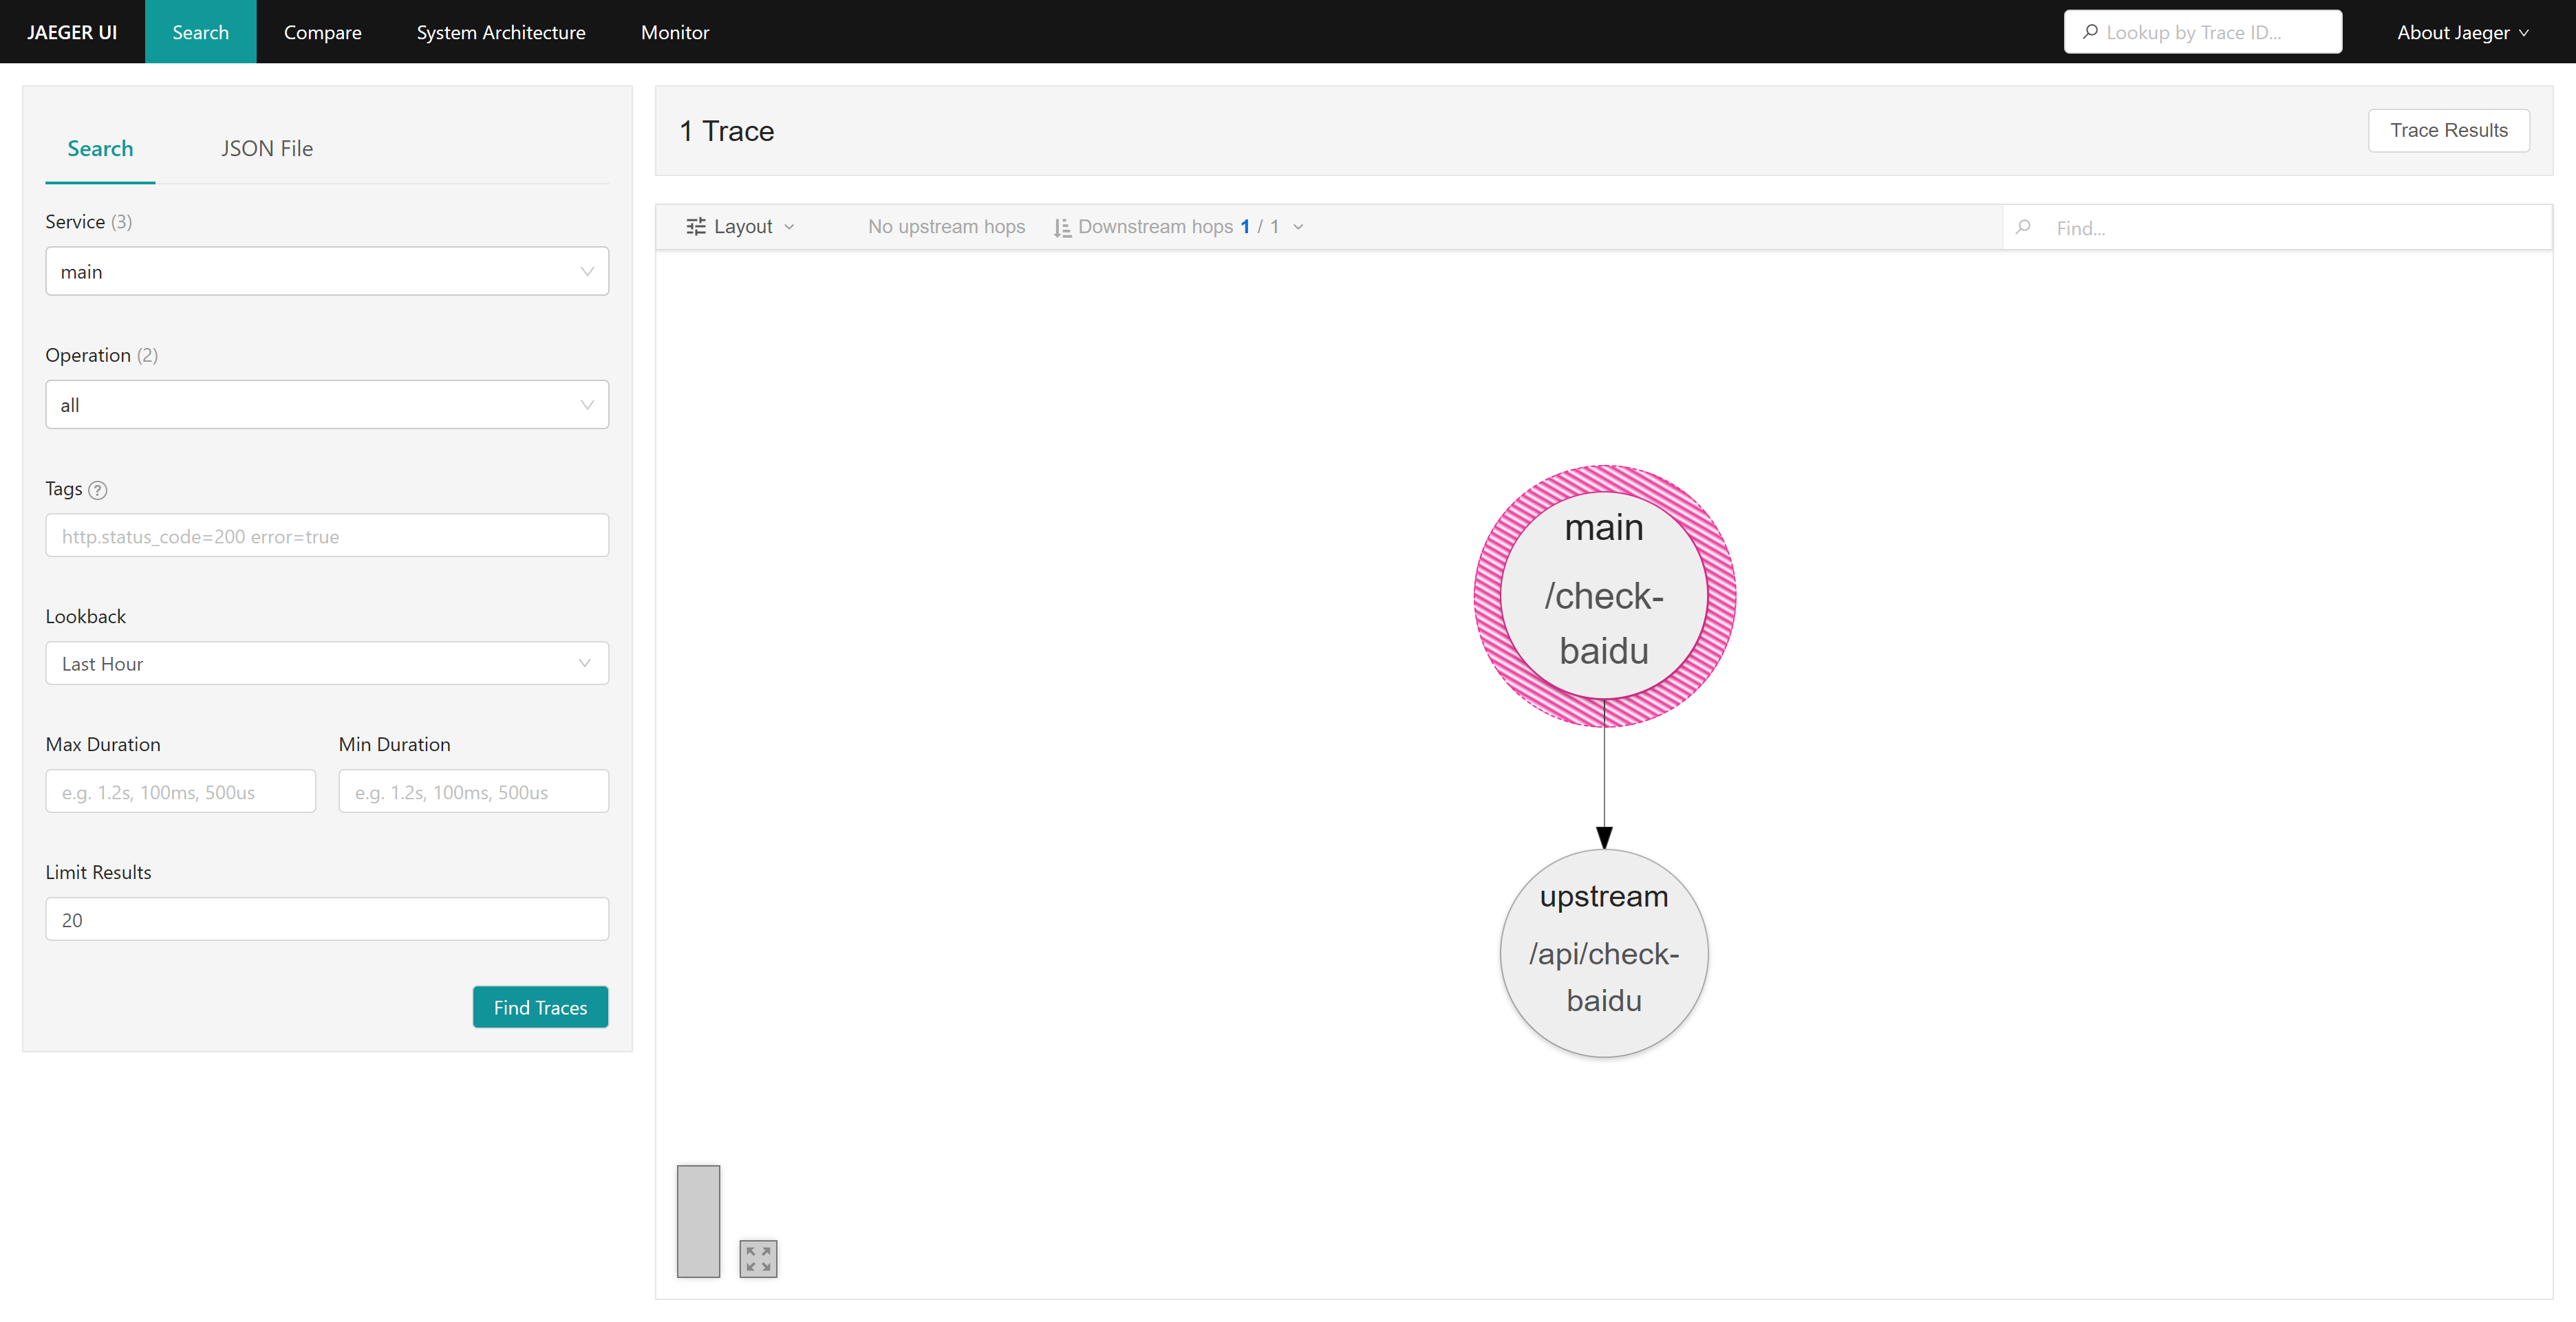
并且可以查看具体是哪些请求链路构成的服务间的调用关系(在 Layout 配置中开启 operations):
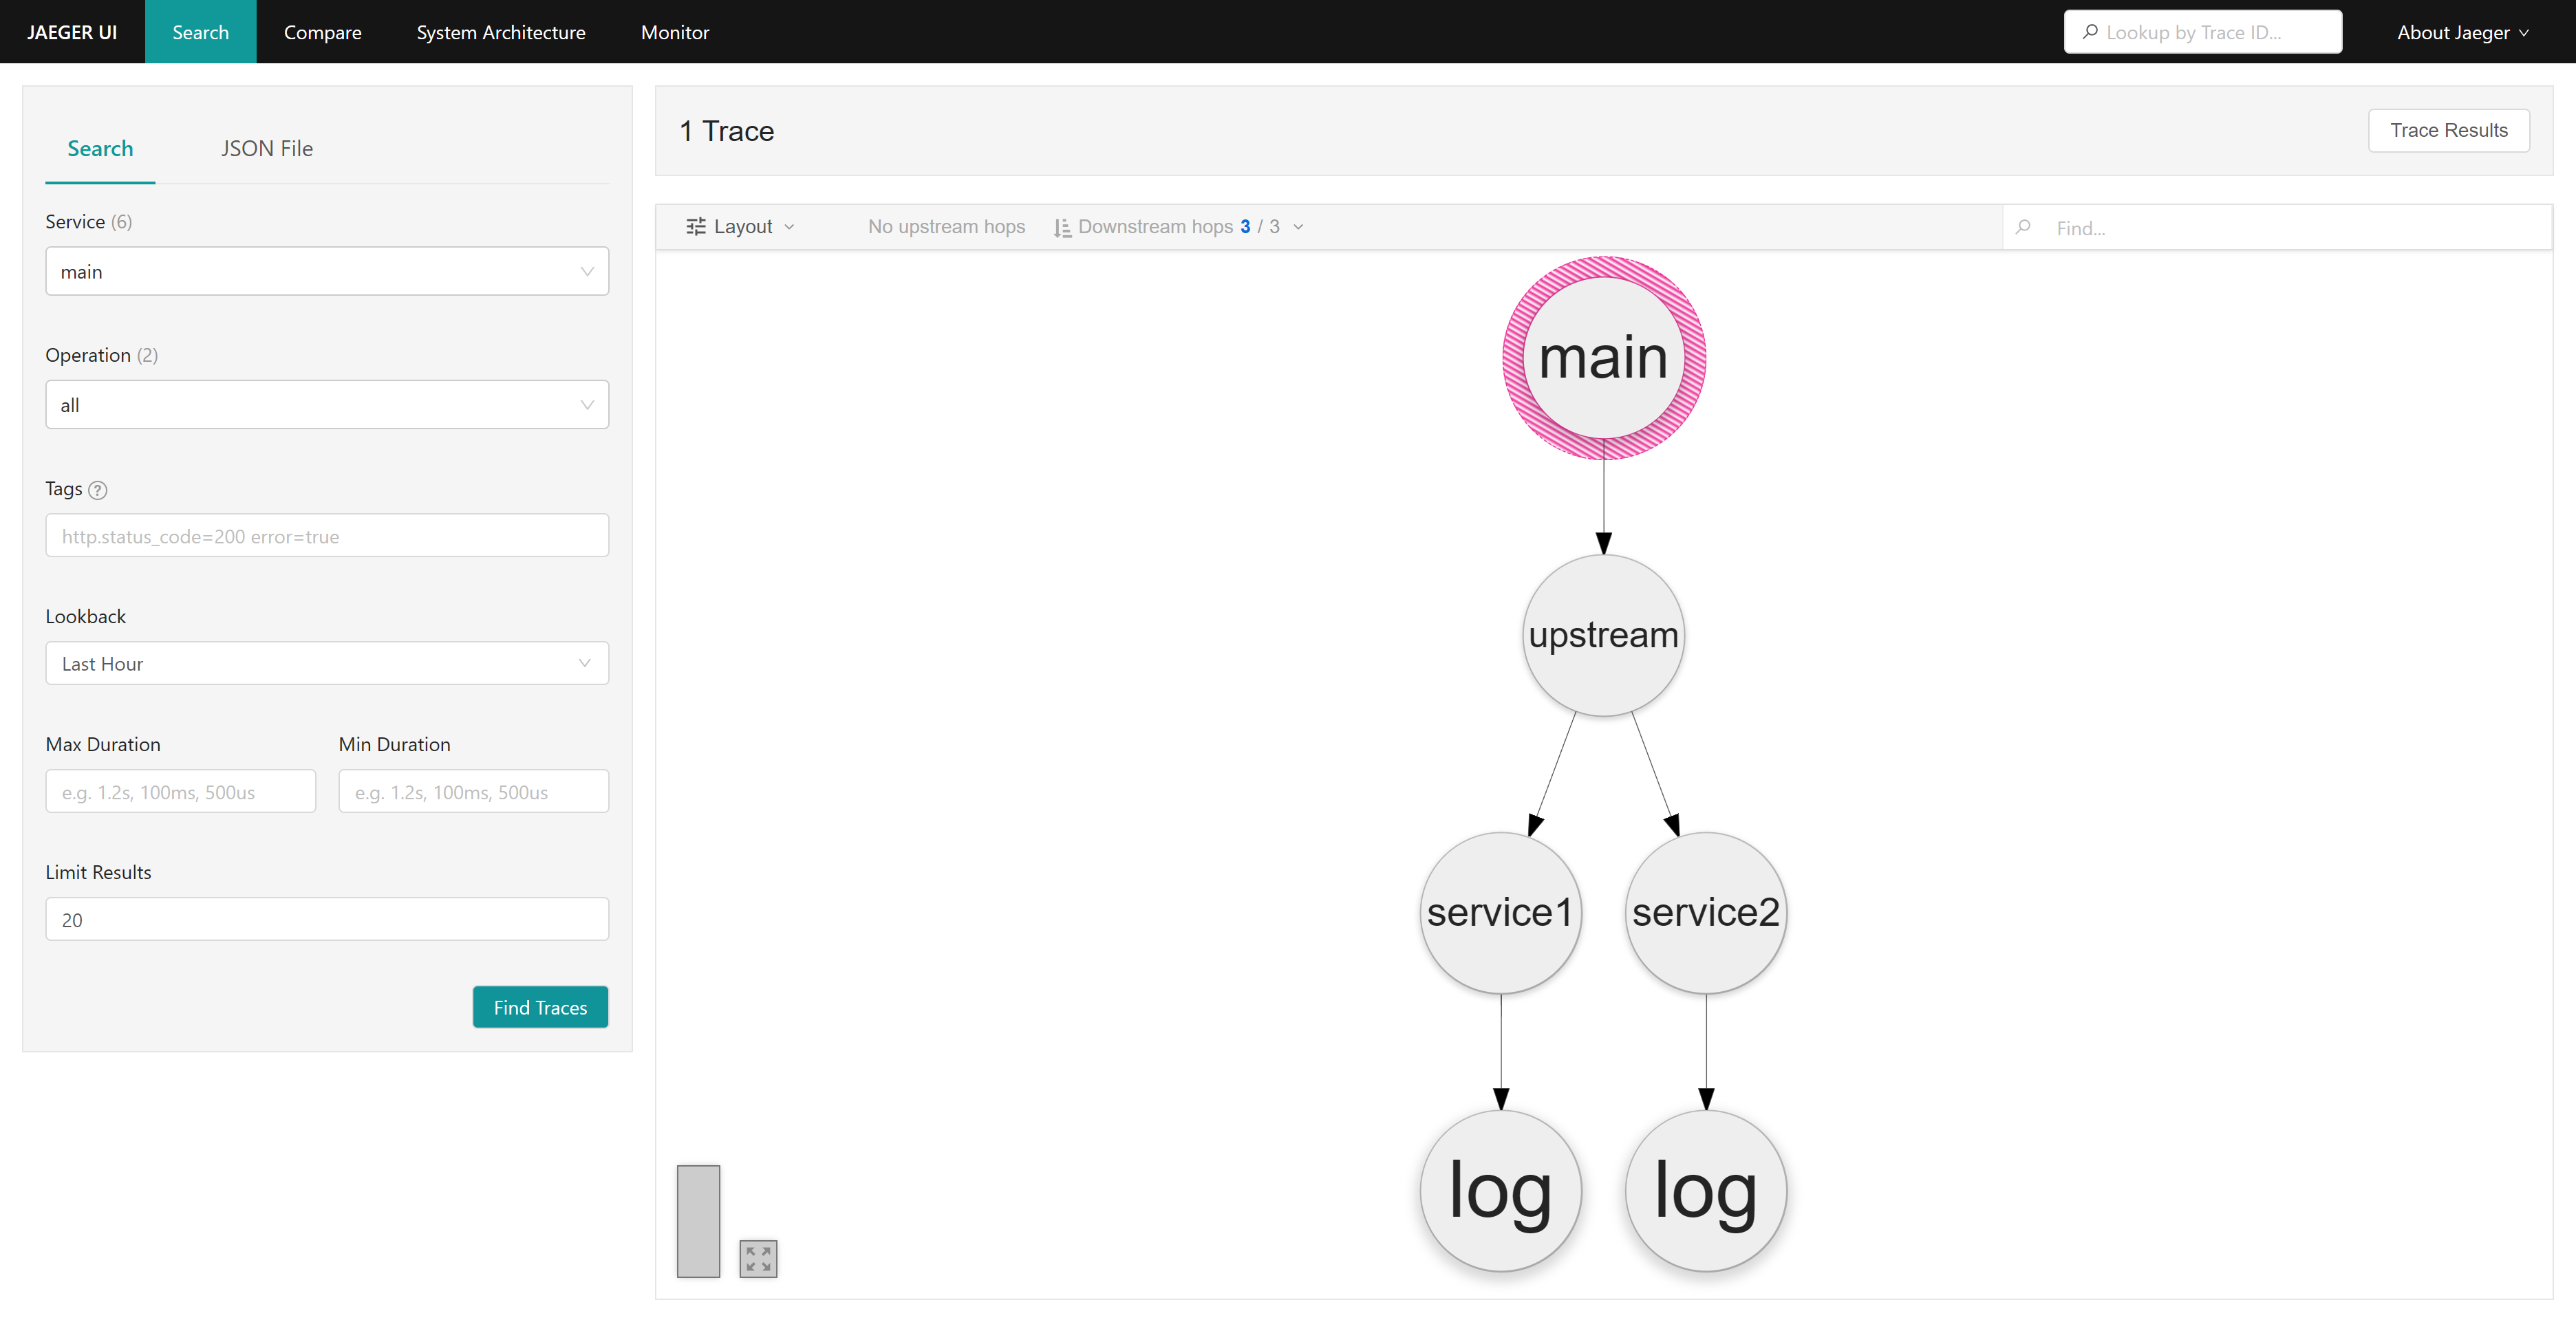
更复杂的场景 我们定义了五个服务,分别是main、upstream、service1、service2、log:
main:主服务,提供/check-sites路由,请求 upstream 服务的/api/check-sites接口。
upstream:上游服务,提供/api/check-sites路由,请求 service1 和 service2 服务的/api/check接口。
services1 与 service2:提供/api/check路由,分别检查百度和腾讯网的可连接性,在请求中请求 log 服务的/api/log接口。
log:提供/api/log路由,持久化 services1 与 service2 的请求日志。
访问 main 服务的/check-sites路由,可以看到请求成功:
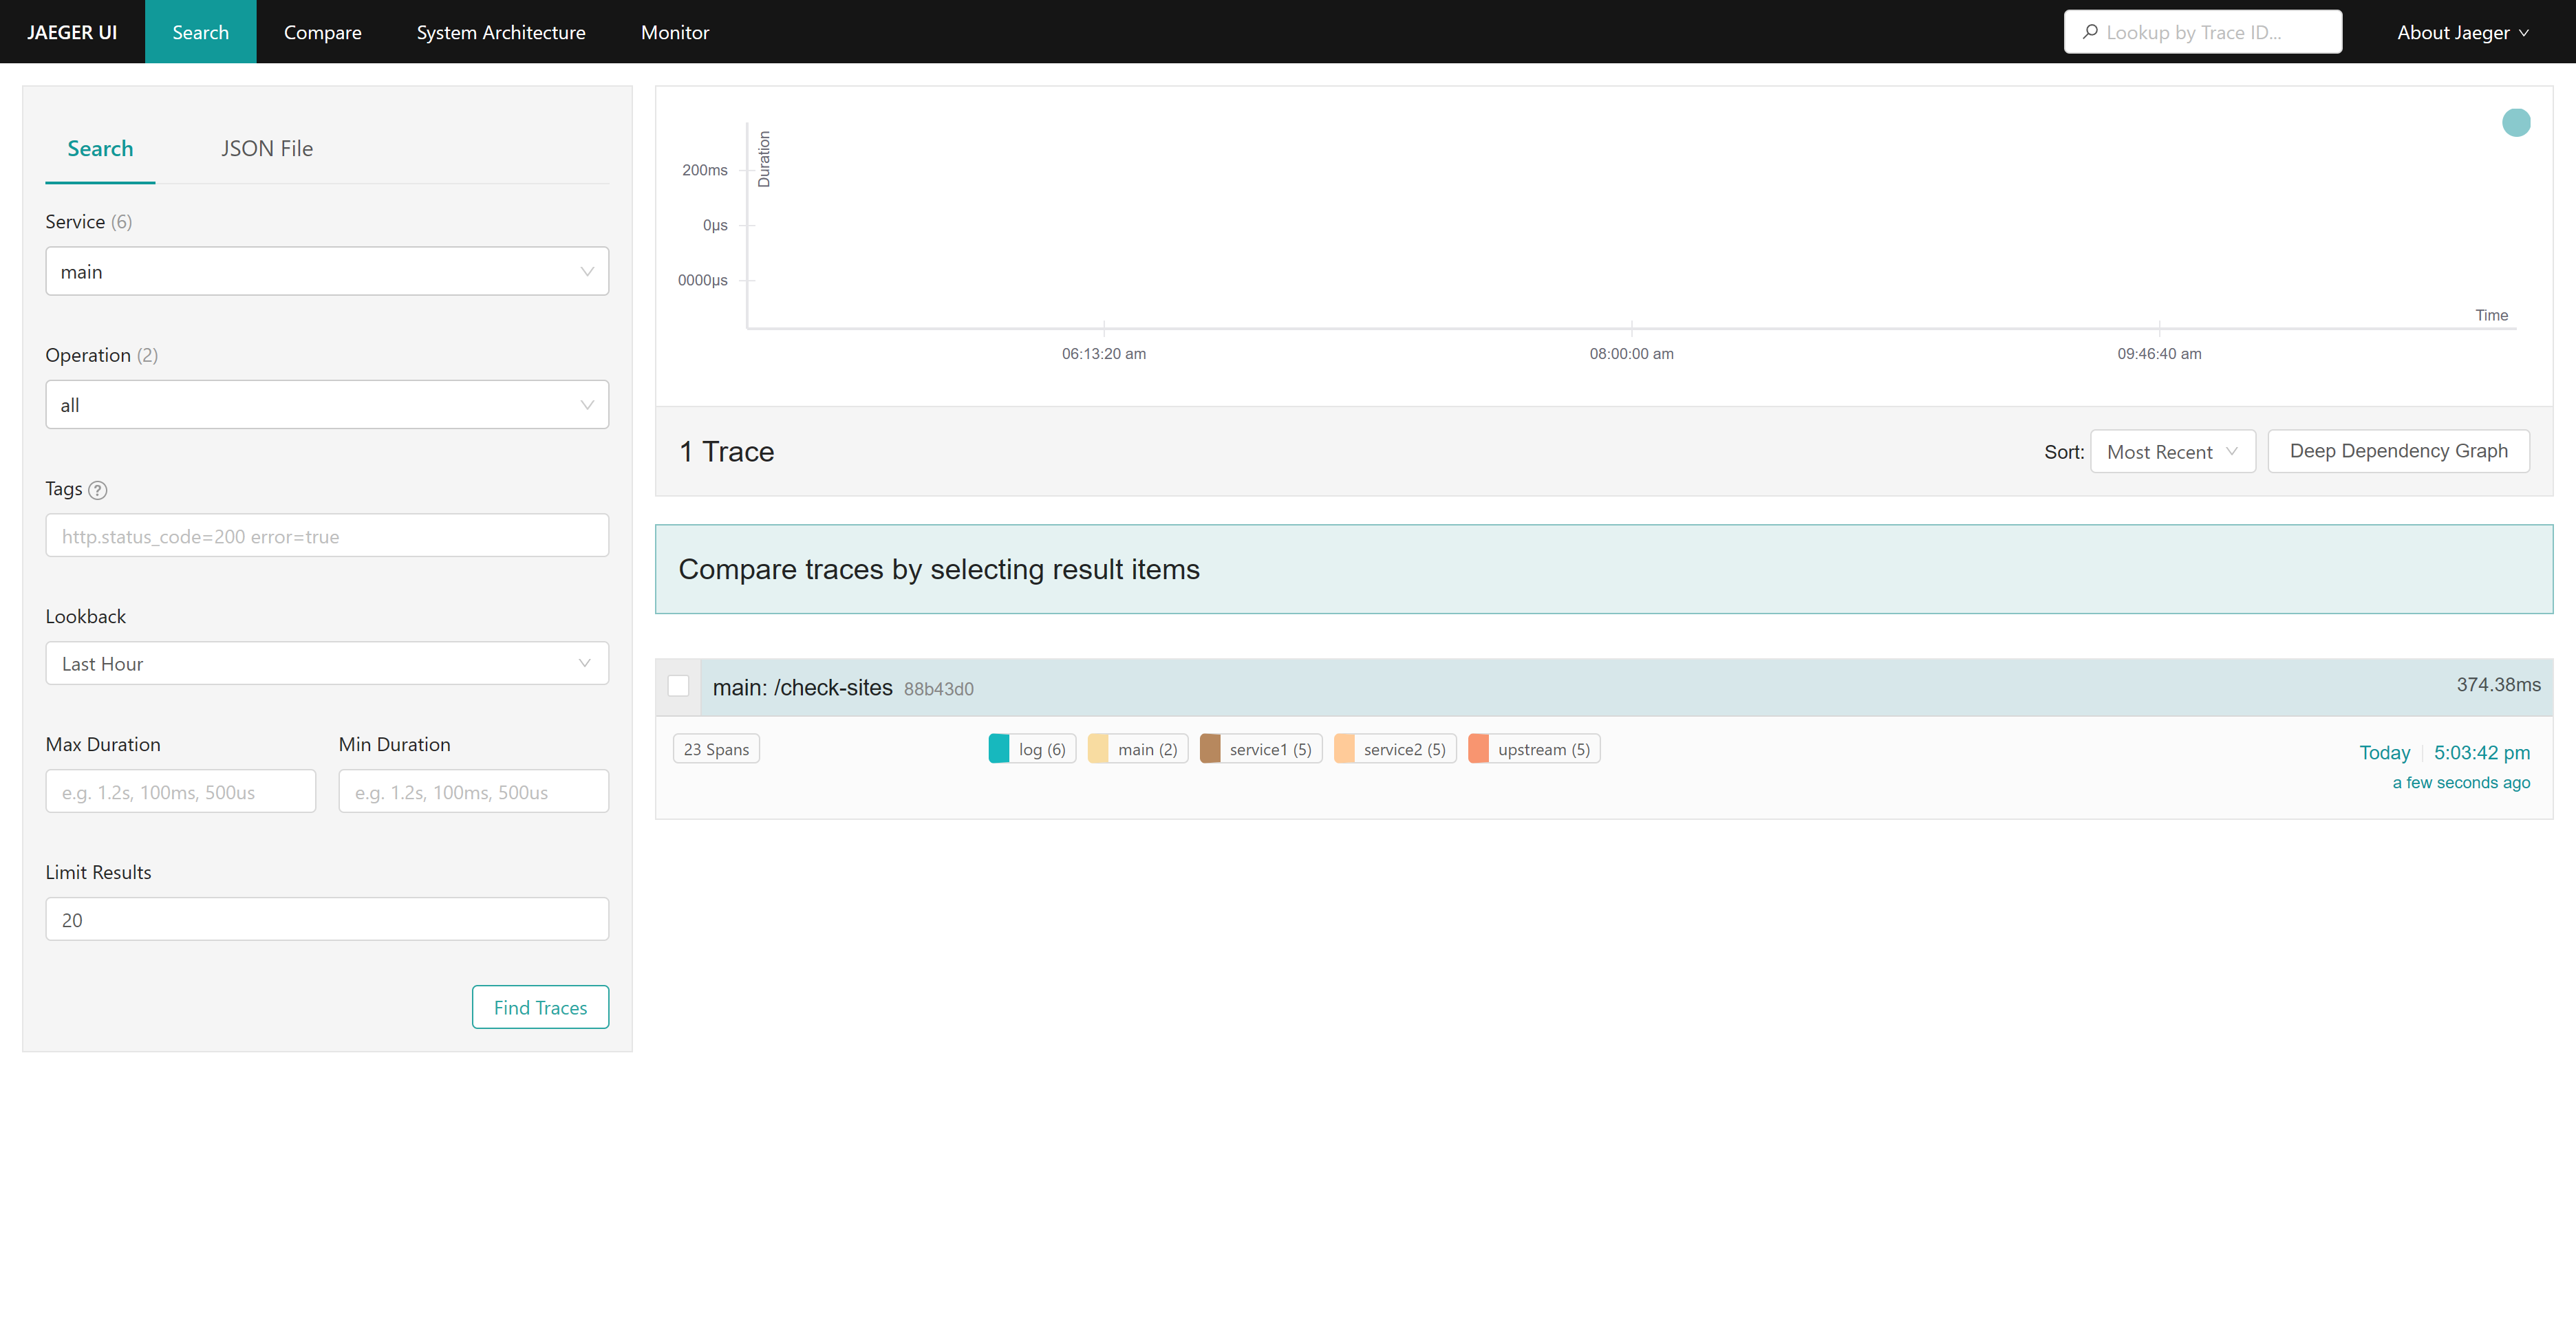
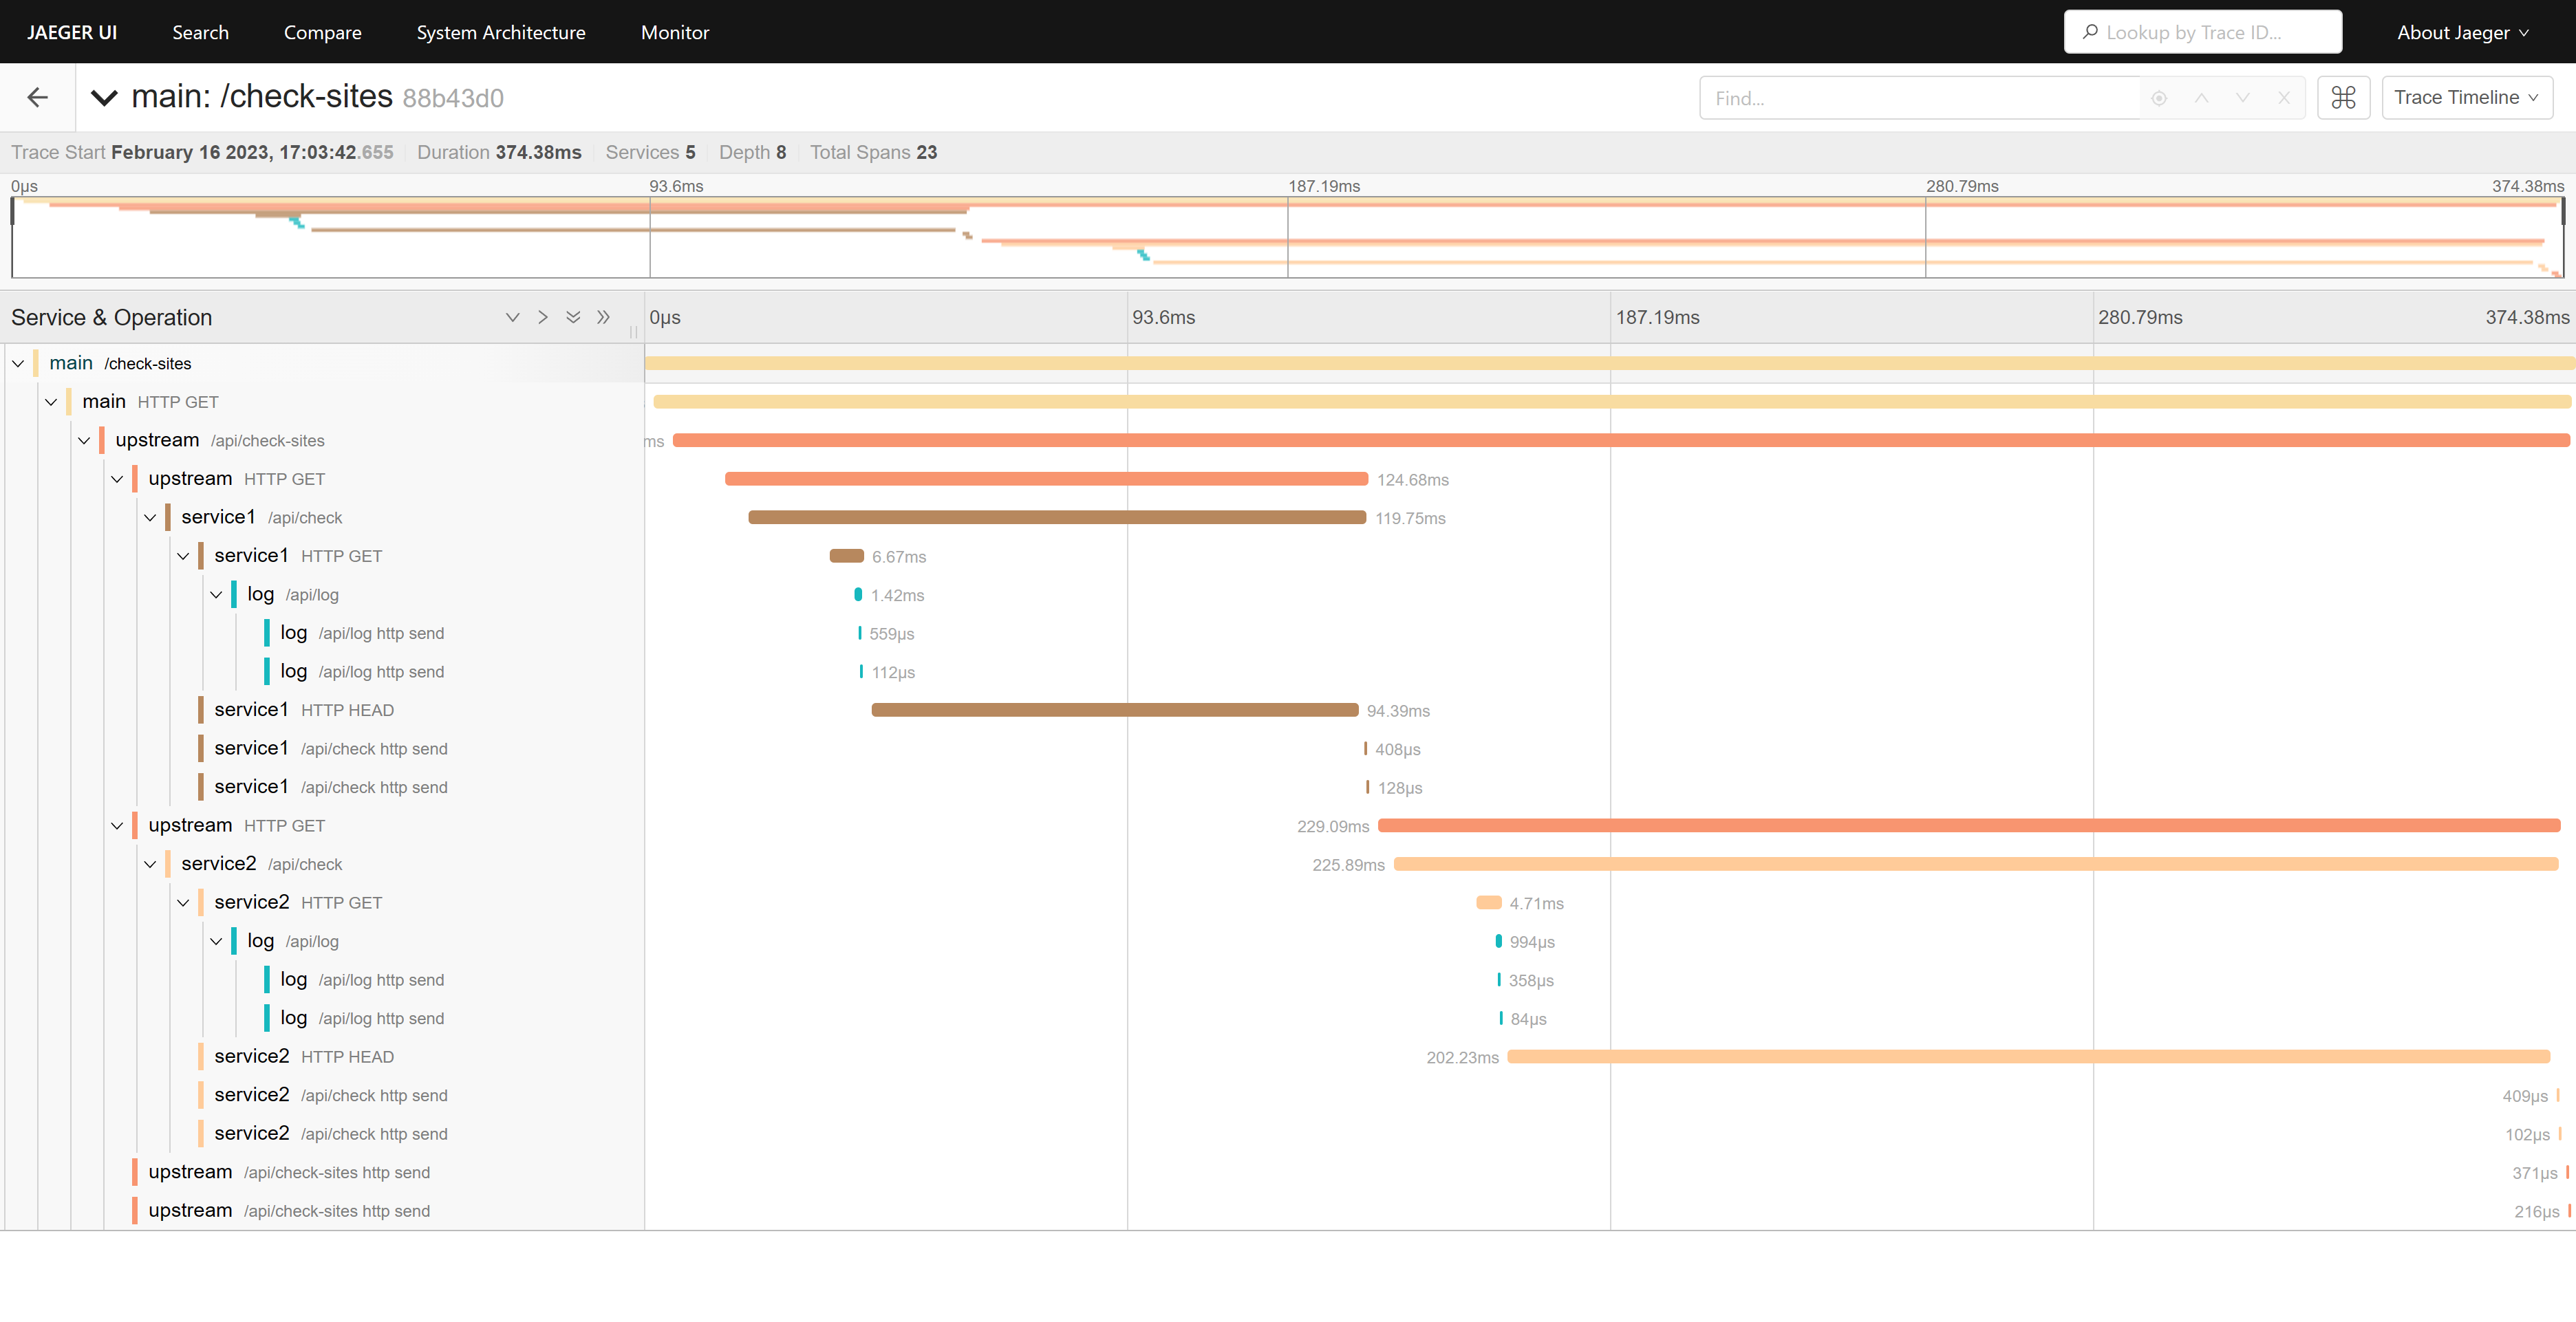
刷新 Jaeger UI ,查看链路追踪信息:
从 trace 信息中可以直观了解到请求链路的细节,比如 upstream 两次请求 service1 和 service2 服务的/api/check接口是串行的,改成并行的话可以有效减少请求时间。
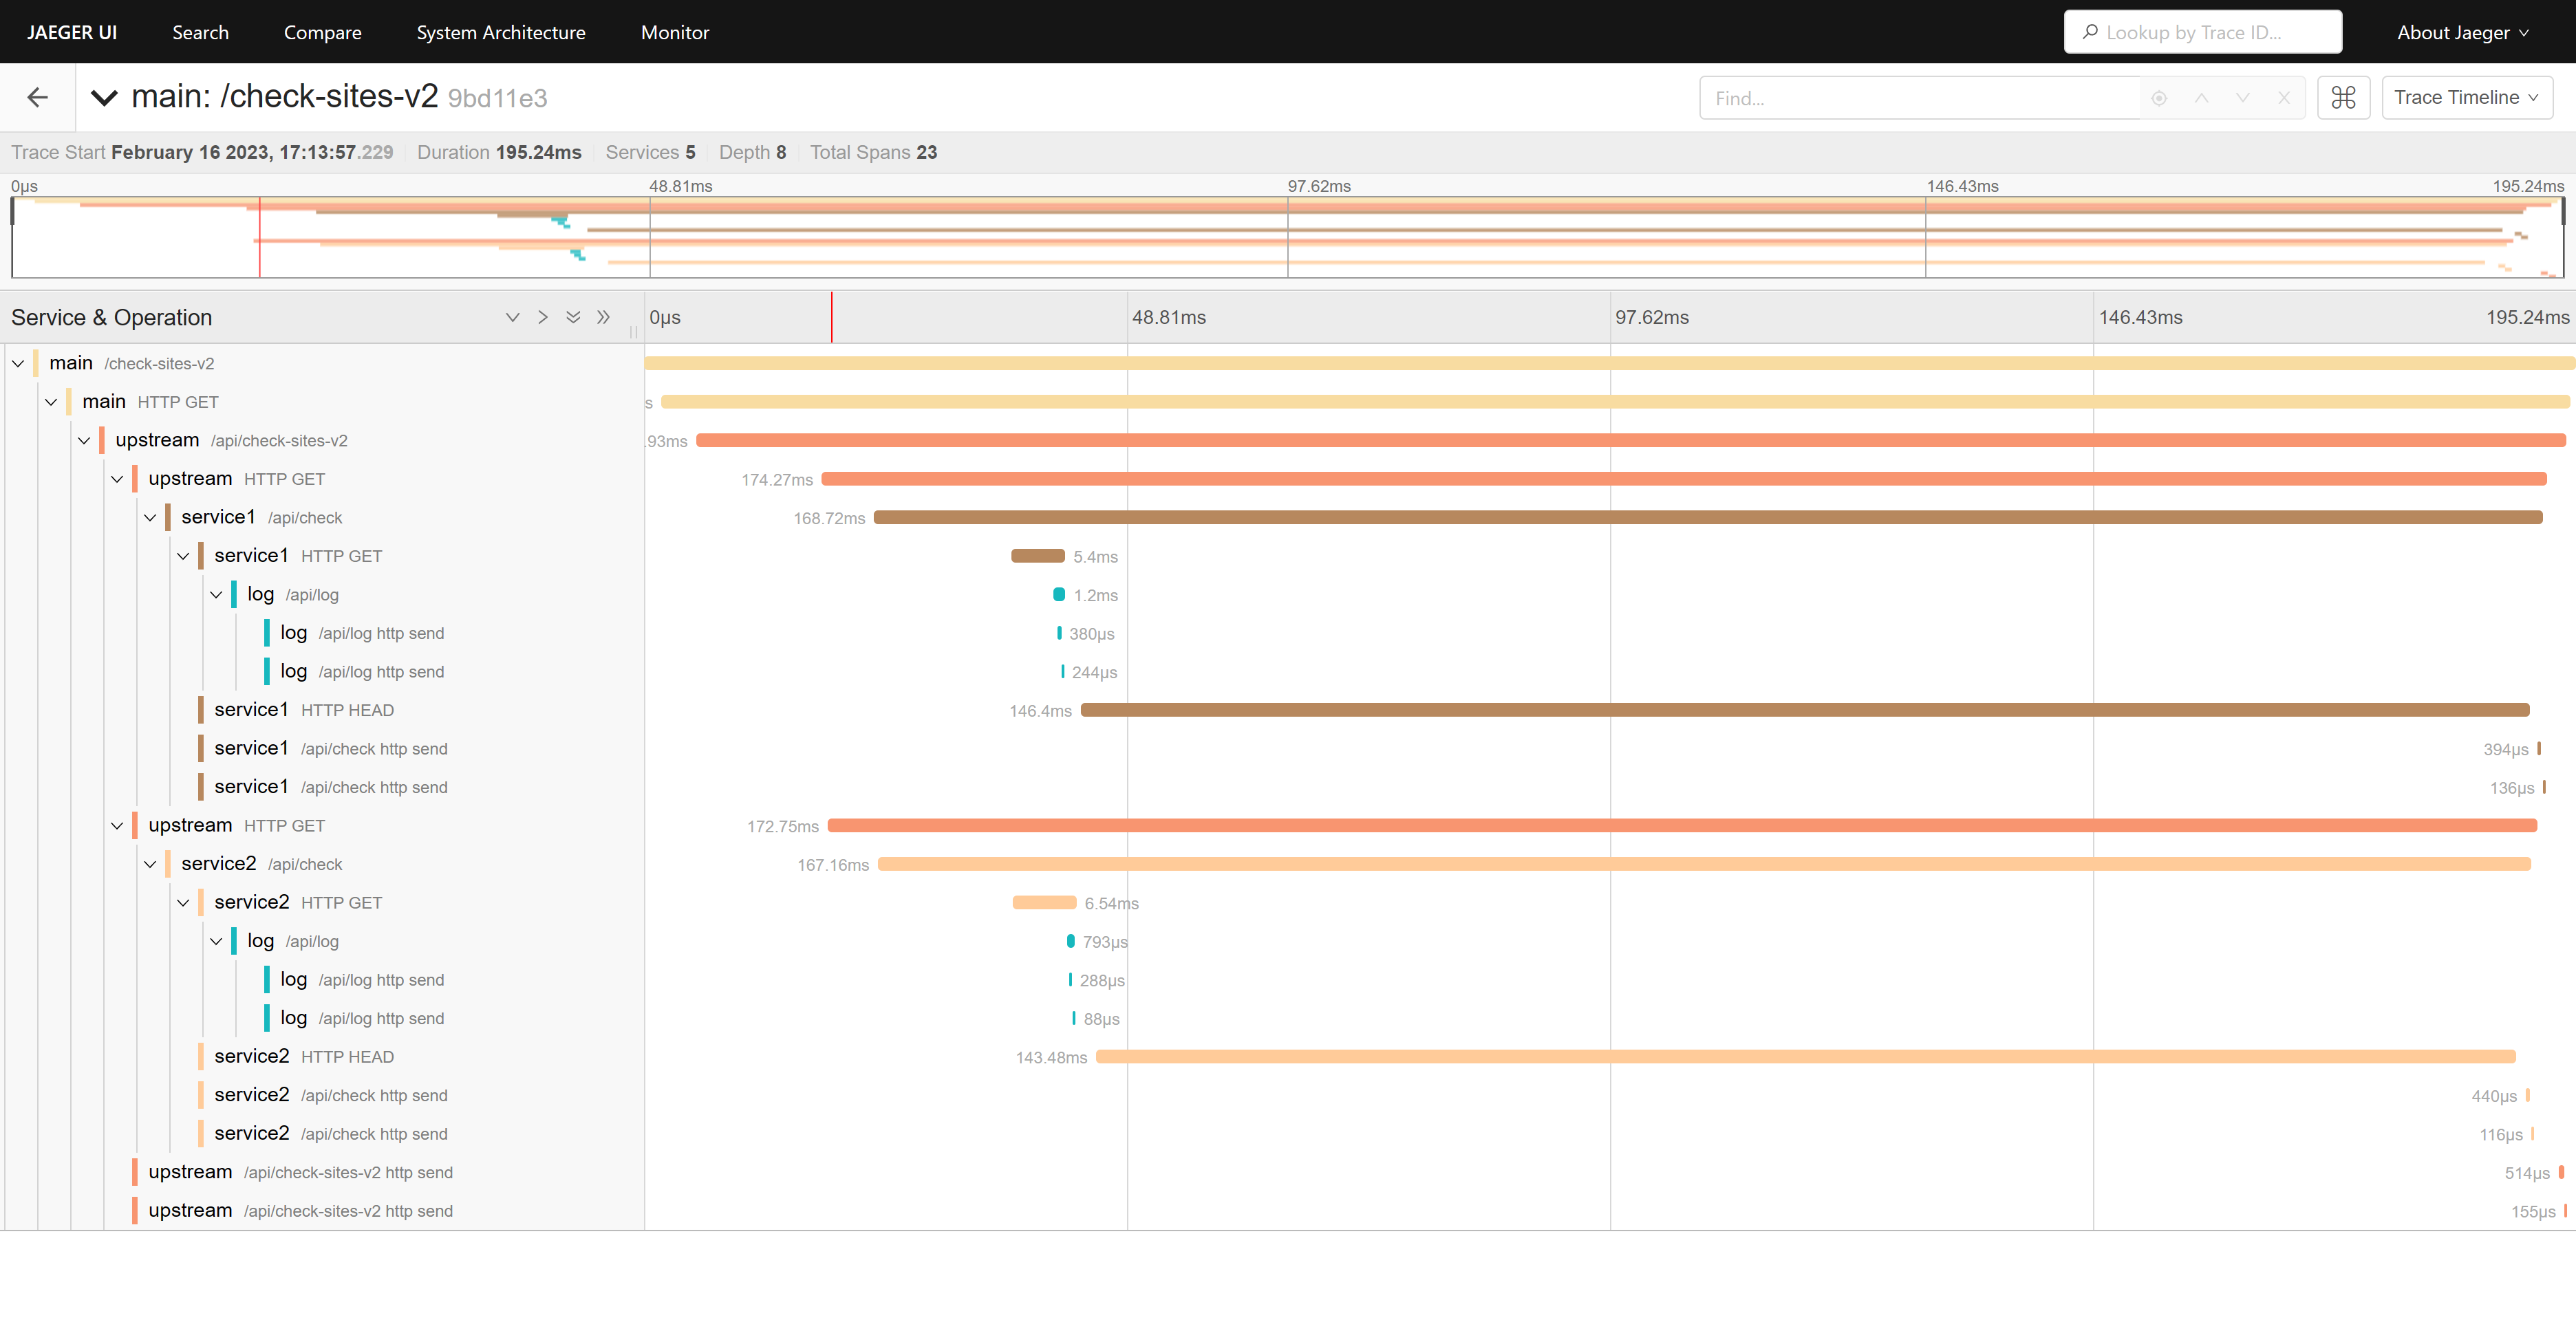
1 2 3 4 5 6 7 8 9 10 11 12 13 14 15 16 17 18 19 @app.get("/api/check-sites" async def check_sites (client: httpx.AsyncClient = fastapi.Depends(get_client ) ): baidu = (await client.get("http://localhost:5002/api/check" )).json()['connected' ] qq = (await client.get("http://localhost:5003/api/check" )).json()['connected' ] return {"baidu" : baidu, "qq" : qq} @app.get("/api/check-sites-v2" async def check_sites_v2 (client: httpx.AsyncClient = fastapi.Depends(get_client ) ): baidu , qq = await asyncio.gather(check("baidu" ,client),check("qq" ,client)) return {"baidu" : baidu, "qq" : qq} async def check (site:str ,client: httpx.AsyncClient ): match site: case "baidu" : return (await client.get("http://localhost:5002/api/check" )).json()['connected' ] case "qq" : return (await client.get("http://localhost:5003/api/check" )).json()['connected' ] case _: return False
实现一个并行的/api/check-sites-v2接口,可以看到请求时间从 374ms 减少到 195ms,提升十分明显。
可以看看目前的服务间调用关系:
总结 本文介绍了如何使用 opentelemetry 和 jaeger 来实现跨服务链路追踪,以及如何使用 opentelemetry 的自动化追踪功能来实现对异步应用的链路追踪。